Category: Graphics
-

Naima’s Break Into Tech Journey: A Photo Story
Discover the inspiring journey of Naima, a woman breaking into the tech world. Follow her on TikTok for motivation and tips on navigating the industry.
-
Capturing Utilities
Capture web page whole size F12 – Browser developer mode Ctrl + shift + P Popup appear Write there “Screen” or “Capture” Find “Capture full size screenshot” Snipping tools The following tools used to capture t opicture the screen of part of it From within windows run snipping tool. LightShot GreenShot Screen recorder (video) VSDC…
-
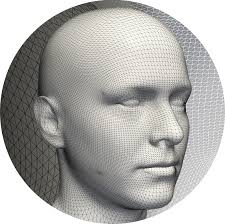
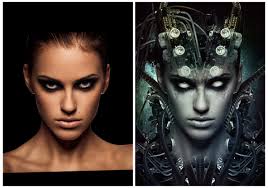
Scalismo – Change faces and morphology
A demo (Geektime) How to install Scalismo More demos Scalismo Faces Github Scalismo Github Scalismo Tutorials Vid2Vid Github
-

UMLet Free UML Tool for Fast UML Diagrams
UMLet is a free, open-source UML tool with a simple user interface: draw UML diagrams fast, buildsequence and activity diagrams from plain text, export diagrams to eps, pdf, jpg, svg, and clipboard,share diagrams using Eclipse, and create new, custom UML elements. UMLet runs stand-alone or as Eclipse plug-in on Windows, OS X and Linux. http://www.umlet.com/
-

Saas – Free online photo-shop alternatives
Pixlr – A free online image editor. Enables to fix, adjust, and filter images in a browser Befunky – Produce stunning photographs and captivating designs with fun, easy-to-use editing tools. Canva – makes design simple for everyone. Create designs for Web or print: blog graphics, presentations, Facebook covers, flyers, posters, invitations and so. Photopea– Great…
-
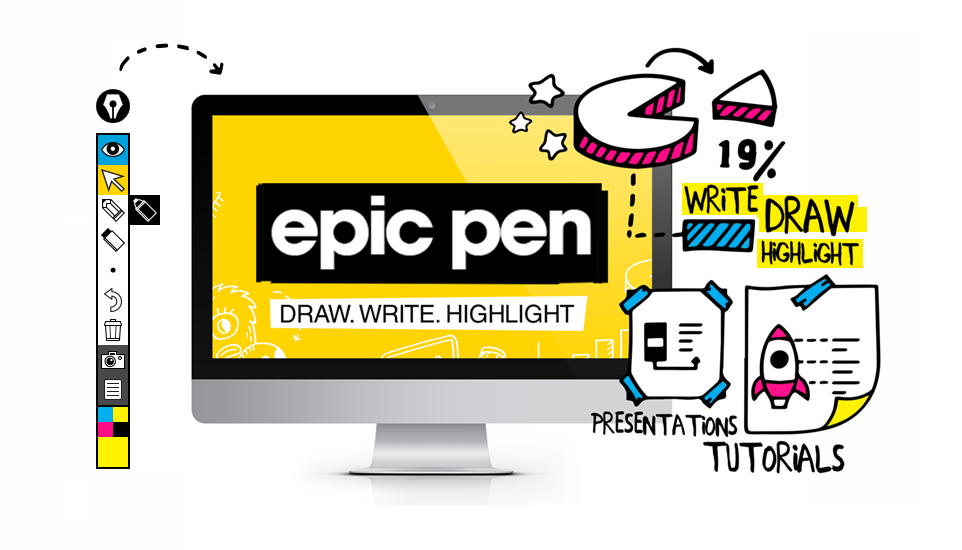
Epic Pen – draw write highlight directly over software video webpages games
Description Epic Pen lets you draw, write or highlight directly over software, video, webpages or games. Unlike many other annotation tools we don’t just screenshot your desktop, we let you edit it live. Our easy to use software is great for business, academics and creatives alike. Make notes, give feedback, improve video tutorials & presentations…
-
Adobe illustrator alternative with Paint.net
How to Open Adobe Illustrator .ai File in Paint.NET: Download Ghostscript software and install it on your system. Download zip file Illustrator Encapsulated PostScript plugin for Paint.NET and extract it. Go to the location where you have installed Paint.NET on your system and open folder named FileTypes. Copy and paste all the extracted files (step 2) to the location…
-
Great Photoshop alternative – Paint.NET PSD Plugin
This is a filetype plugin for Paint.NET that enables both loading and saving of Photoshop .PSD files. It was originally written by Frank Blumenberg in 2006, and has been maintained by Tao Yue since 2010. Tao’s web page: http://www.taoyue.com/ Tao’s email address: [email protected] https://psdplugin.codeplex.com/ How to install the plugin Make sure you have Paint.NET 4.0…
-
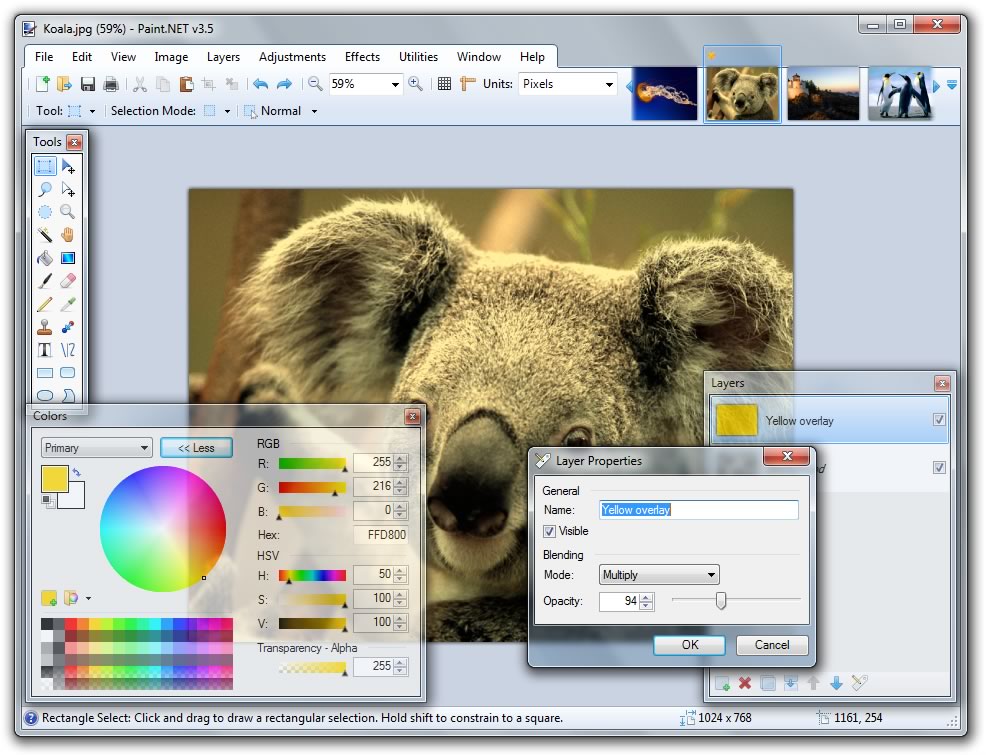
Great Photoshop substitute / Paint.net and Plugins
Paint.NET is free image and photo editing software for PCs that run Windows. It features an intuitive and innovative user interface with support for layers, unlimited undo, special effects, and a wide variety of useful and powerful tools. An active and growing online community provides friendly help, tutorials, and plugins. Download it from here Plug-ins…
-
EASILY CREATE STUNNING ANIMATED CHARTS WITH CHART.JS
EASILY CREATE STUNNING ANIMATED CHARTS WITH CHART.JS BY SARA VIEIRA · JAVASCRIPT · NOV 4, 2013 Charts are far better for displaying data visually than tables and have the added benefit that no one is ever going to press-gang them into use as a layout tool. They’re easier to look at and convey data quickly,…
-

charts and Charting frameworks
No Link License Platform More info 1 Highsoft Workshow Commercial 2 Chart.JS Open Source Javascript 3 D3.JS Open Source Javascript D3 Gallery 4 Chartist.JS Open Source Javascript 5 Dimple Open Source Javascript Dimple Examples 6 Flot Open Source Javascript/JQuery Flot Examples 7 Sencha Ext.JS Commercial Javascript Sencha Examples 8 pChart Commercial, Free for non profit…
-
Mockup Resources
Mockup Resources 01 – Draw.io – http://wp.flash-jet.com/draw-io-great-diagramming-tool/ 02 – Marvel App – https://marvelapp.com/ 03- Balsamiq – https://balsamiq.com/ 04 – Paint .Net – http://www.getpaint.net/index.html
-
3 Simple steps to display Graph with Chart.JS
3 Simple steps to display Graph with Chart.JS First download chart.js Step 1: Create HTML Template: <!DOCTYPE html> <html lang=”en”> <head> <meta charset=”utf-8″ /> <title>Chart.js demo</title> <script src=’Chart.min.js’></script> </head> <body> </body> </html> Step 2: Add Canvas:: <!DOCTYPE html> <html lang=”en”> <head> <meta…
-
Chart.js Simple, clean and engaging charts for designers and developers
Chart.js – Simple, clean and engaging charts for designers and developers Resources: 01 – Homepage: http://www.chartjs.org/ 02 – Exaples: http://www.webdesignerdepot.com/2013/11/easily-create-stunning-animated-charts-with-chart-js/ 03 – 3 and a half steps for creating graphs an charts with Chart.JS: http://wp.flash-jet.com/4-simple-steps-to-display-graph-with-chart-js/
-
Draw.io – Great Diagramming tool
Draw.io – Great Diagramming tool Great Website for diagramming and it is free. It allows to to share and save and export from/to most common formats. Here is the welcome screen: Main screen User interface: https://www.draw.io/